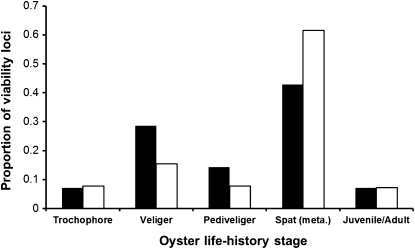
Figure 3.
Distributions of viability loci across life stages of the Pacific oyster. Bars represent the proportion of viability loci expressed at each stage and sum to 1.0 for each family (solid bars correspond to family 46×10 and open bars to family 51×35). Stages are, approximately, 0–24 hr (trochophore), 1–14 days (veliger), 15–18 days (pediveliger), 18–30 days (spat/metamorphosis), and 30–700 days (juvenile/adult).

