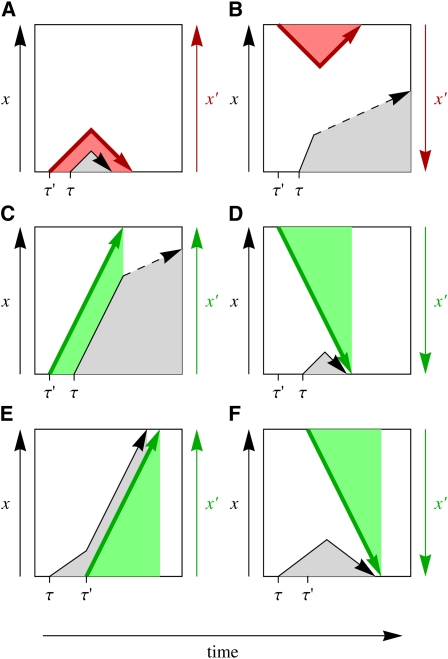
Figure 2 .
Interference time series diagrams. A target mutation with origination time τ and frequency x(t) (black arrow) is subject to a stronger interfering mutation with origination time τ′ and frequency x′(t) (colored arrow). The interactions between this pair of mutations can be classified as follows: (A and B) Interference by a deleterious background mutation (red arrow). (A) The target mutation originates on the deleterious allele of the interfering mutation and is driven to loss, and (B) the target mutation originates on the ancestral (beneficial) allele of the interfering mutation and is enhanced in frequency. (C and D) Interference by a beneficial background mutation (green arrow). (C) The target mutation originates on the beneficial allele of the interfering mutation and is enhanced in frequency, and (D) the target mutation originates on the ancestral (deleterious) allele of the interfering mutation and is driven to loss. (E and F) Interference by a beneficial future mutation (green arrow). (E) The interfering mutation originates on the new allele of the target mutation and drives it to fixation, and (F) the interfering mutation originates on the ancestral background of the target locus and drives the target mutation to loss.

