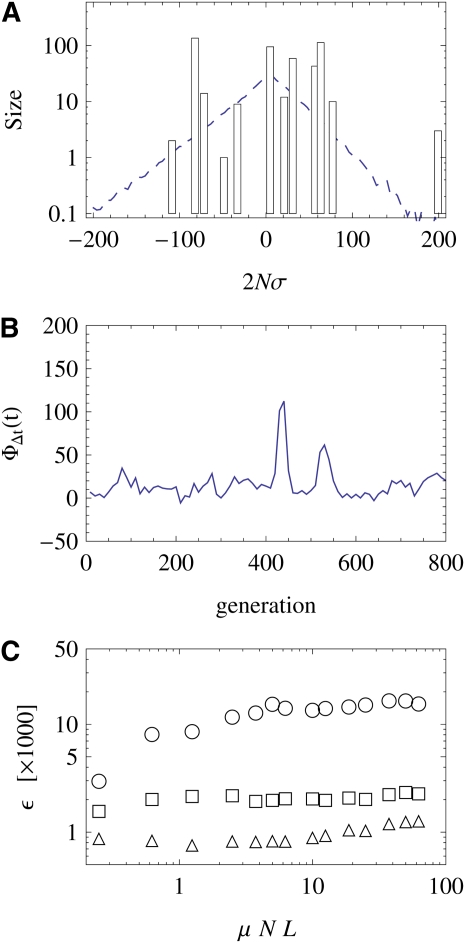
Figure 7 .
Stochasticity of the adaptive process. The speed of adaptation and the shape of the distribution of fitnesses in the population are governed by large fluctuations. (A) Snapshot of the fitness distribution in the population, centered around the mean fitness. The shape of this distribution is very different from the average shape, shown as a dashed line. The dynamics are governed by few fitness classes with a large number of individuals (note the logarithmic axis). The evolution of this distribution is shown in three movies; see Figure 8. (B) Time series of the cumulative fitness flux ΦΔt(t), which is defined as the net selective effect of all allele frequency changes Δxi(i = 1, … , L) within a short time interval Δt (Mustonen and Lässig 2010): (we use Δt = 20 generations). This flux is intermittent; i.e., the traveling fitness wave has short-term boosts in its speed. (C) Stochasticity of the fitness flux. The ratio of variance and mean fitness flux ΦΔt(t) over a population’s history is plotted as a function of the total mutation rate μNL for selection shape parameters κ = (circles), κ = 1 (squares), and κ = 2 (triangles). For a given total mutation rate, the stochasticity is highest for κ = and decreases with increasing κ. However, the stochasticity remains approximately constant for increasing system size. Other simulation parameters are N = 500 (a and b), N = 1000 (c), L = 500, 2Nγ = 0.1, 2Nγ = 0.025, κ = 1, and .

