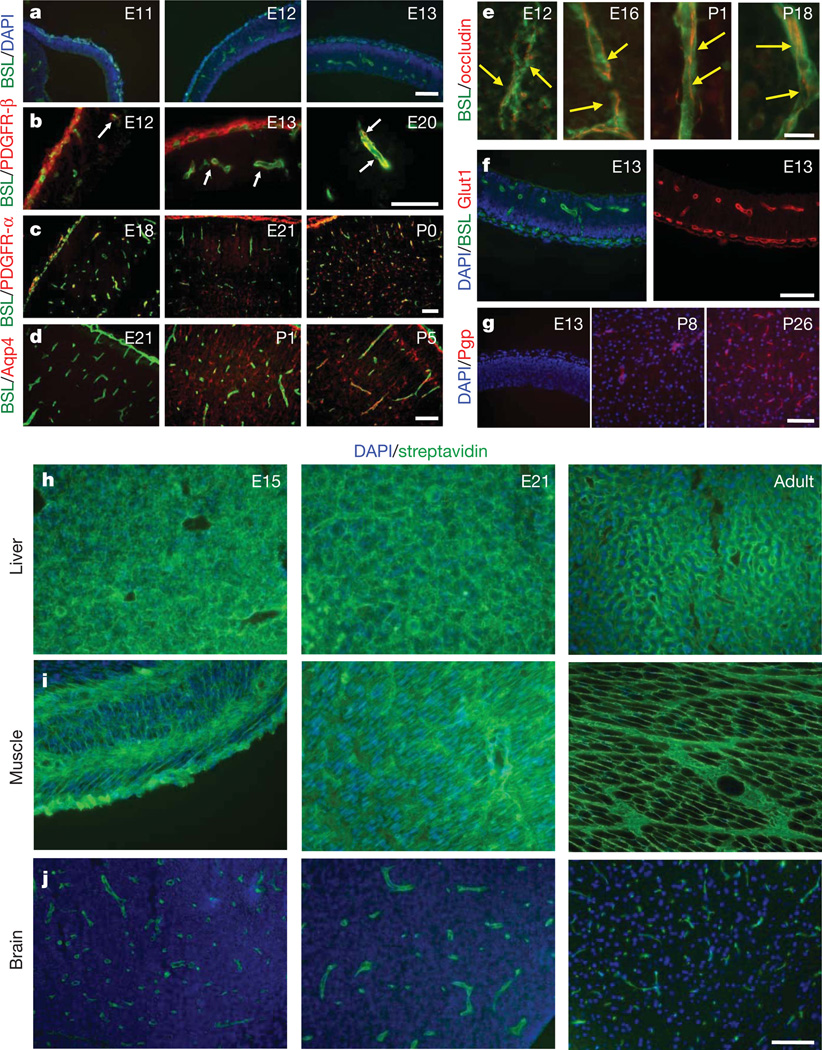
Figure 1. Time course of cell generation and BBB development in the rat cerebral cortex.
a–g, Sections of rat cerebral cortex at indicated ages were stained for endothelial cells with Bandeiraea simplicifolia lectin I (BSL) (green, a–f) and nuclei with DAPI (blue, a, f (left), g), pericytes with anti-PDGFR-β (red, b; white arrows point to pericytes), oligodendrocyte progenitors with anti-PDGFR-α (red, c), astrocytes with anti-aquaporin 4 (red, d), anti-occludin (red, e; yellow arrows indicate tight-junction strands), anti-Glut1 (red, f (right)), and anti-Pgp (red, g). Scale bars represent 100 µm (a–d, f, g) and 20 µm (e). h–j, Rats aged E15 (left), E21 (middle) and adults (right) were given a trans-cardiac perfusion of biotin, and liver (h), muscle (i) and brain (j) tissue sections were stained with streptavidin (green) and DAPI (blue). Scale bar represents 100 µm.

