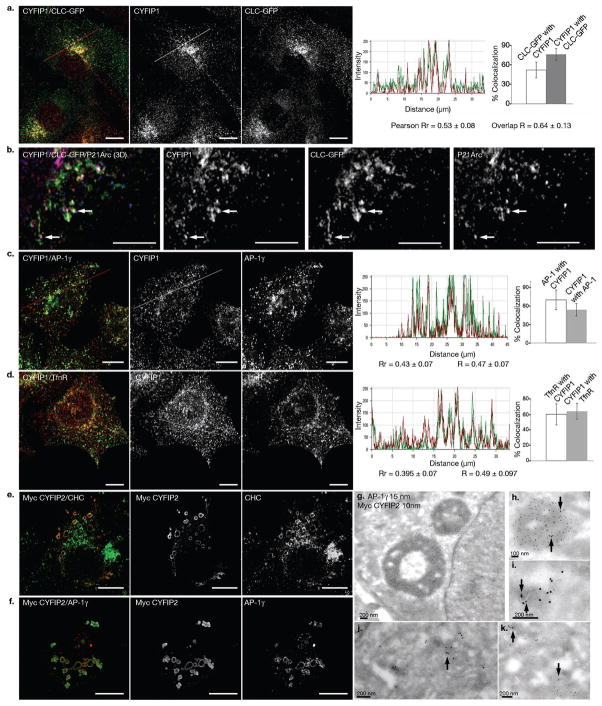
Figure 1. Localization of CYFIP1 and CYFIP2.
(a, b) BSC-1 cells stably expressing clathrin light chain (CLC)-EGFP were labeled with antibodies against CYFIP1 (red) and (b) P21-Arc (blue). (c, d) HeLa cells were labeled with antibodies against CYFIP1 (red) and (c) AP-1γ (green) or (d) transferrin receptor (green). (e, f) HeLa cells transiently expressing myc-tagged CYFIP2 were labeled with antibodies against myc, (e) clathrin heavy chain (CHC, green) or (f) AP-1γ (red). Co-localization was analyzed and quantified with Volocity 5.2 software. R represents the overlap coefficients, Rr the Pearson correlation coefficients. Data is presented as mean ± s.d. (in each case, 20 – 25 cells from n= 3 different experiments). Scale bars, (a, c-f) 10 μm, (b) 5 μm. (g-k) HeLa cells transiently expressing myc-tagged CYFIP2 were processed for electron microscopy. Thawed cryosections were co-labeled with anti-AP-1 (15 nm gold particles) and anti-myc antibodies (10 nm gold particles). (g, h) Arrows indicate AP-1 present on myc-tagged CYFIP2 enlarged intracellular structures, or (i-k) AP-1 and CYFIP2 co-localization on intracellular membranes.

