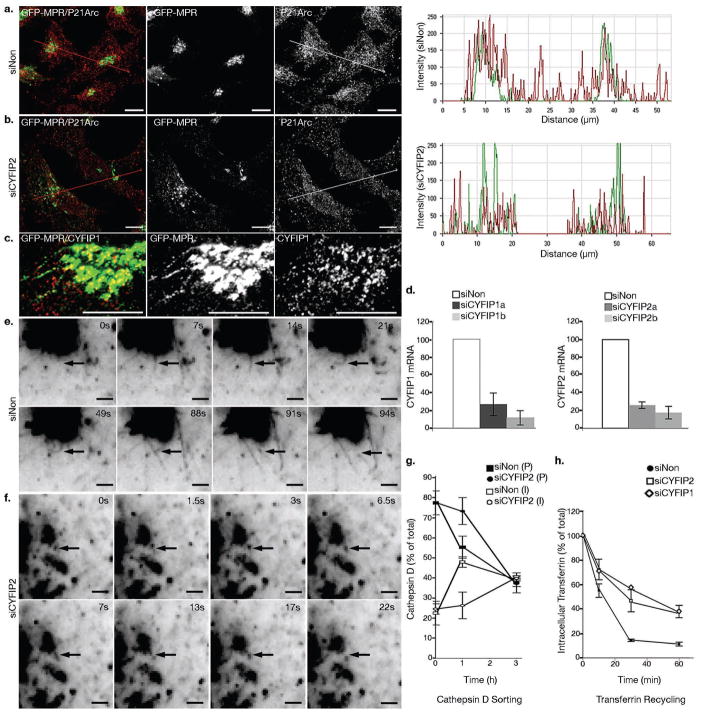
Figure 4. CYFIP2 depletion disrupts organelle integrity and decreases transport carrier biogenesis.
GFP-MPR expressing HeLa cells were treated with control siRNAs or with siRNAs targeting CYFIP2 or CYFIP1. (a) Cells were labeled with anti-P21-Arc (red) and co-localization between GFP-MPR and P21-Arc in the TGN region was analyzed. 20 cells from n = 3 independent experiments were analyzed for each condition. (c) Confocal fluorescence analysis indicated that CYFIP1 localized along GFP-MPR tubules (n = 20 cells). Scale bars, 10 μm. (d) The levels of CYFIP1 and CYFIP2 mRNAs following the indicated knock-downs were measured by Q RT-PCR; GAPDH was used as a control (n = 4 independent experiments; data represent the mean ± s.d.). (e, f) Cells were examined by time-lapse videomicroscopy. The number of GFP-MPR positive tubules exiting from the GFP-MPR rich compartment was analyzed as shown in Table I. Scale bars, 2 μm. (g) HeLa cells were labeled with 35S Methionine for 30 min, then pulse-chased for the indicated times. Cathepsin D was immunoprecipitated from the lysates and analyzed by SDS-PAGE. The relative levels of the precursor (P) and intermediate (I) forms were quantified relative to the total Cathepsin D levels (n = 3 independent experiments; data represent the mean ± s.d.). (h) For measuring Tfn recycling, cells were starved for 1 h, then incubated with fluorescent-labeled Tfn for 1h, and chased at 37°C in the presence of unlabeled Tfn for the indicated times. The amount of intracellular labeled Tfn was measured by fluorescence microscopy and quantified using ImageJ (n = 3 independent experiments for siNon and siCYFIP2; data represent the mean ± s.d.).

