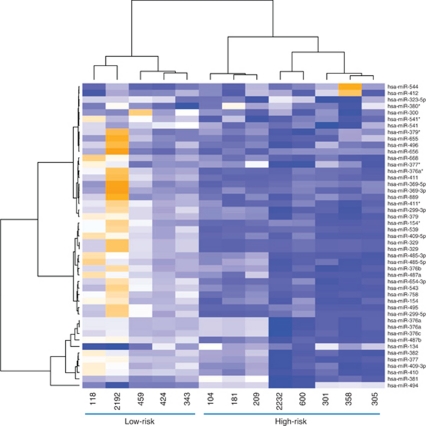
Figure 2.
Summary heat map showing the clustering based on 14q32.31 miRNA cluster. Data are represented as two dendrograms. The vertical dendrogram indicates patient sample with closest miRNA expression patterns. The horizontal dendrogram indicates miRNA with closest expression pattern across all patient samples. The Euclidian distance has been used as distance metric, and the clustering is using the ‘ward’ method to gather miRNAs or patient samples together. The heat map colours range from orange (high intensity values) to blue (low intensity values). The miRNAs used for the clustering strongly discriminate the high-risk from the low-risk neuroblastoma. See also Table 1 and Supplementary Table 3.

