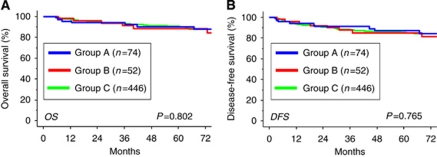
Figure 1.
Kaplan–Meier estimated OS (A) or DFS (B) of all EOC patients at stage I. Survival curves were stratified by the surgical procedure and patients’ age. All EOC patients were divided into three groups: group A, patients who underwent FSS under 40 years old; groups B (under or equal to 40 years old) and C (over 41 years old), patients who underwent conventional RS, as described in ‘Materials and Methods section’ (group A (n=74), solid blue line; group B (n=52), solid red line; group C (n=446), solid green line).

