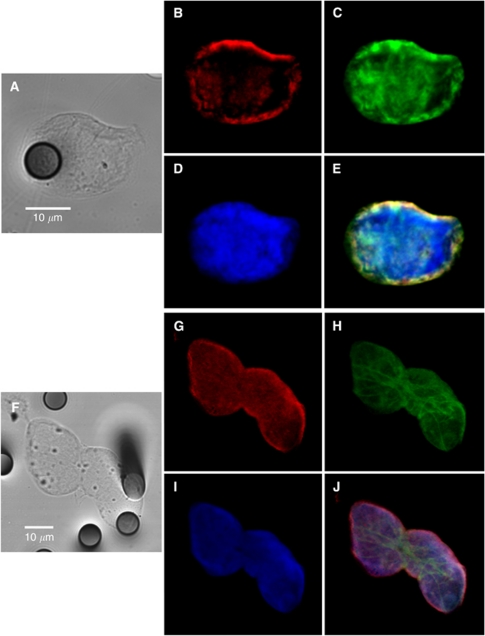
Figure 1.
Confocal microscopic analysis of CTCs expressing a hybrid phenotype. Examples of an isolated CTC (A–E) and of a cluster of CTCs (F–J) from two patients with metastatic NSCLC. Tumour morphology is visualised by equatorial Z-plane bright field image (A and F). Keratins (B and G), vimentin (C and H) and equatorial Z-plane nucleus (D–I) images are merged on E and J. Optical slice thickness allows the detection of both nuclear and cytoplasmic signals. During analysis using ImageJ, colours were assigned arbitrarily, that is, green, red and blue colours for AF488, AF647 and SYTOX orange, respectively. The 8-μm wide pores are visible on bright field images.

