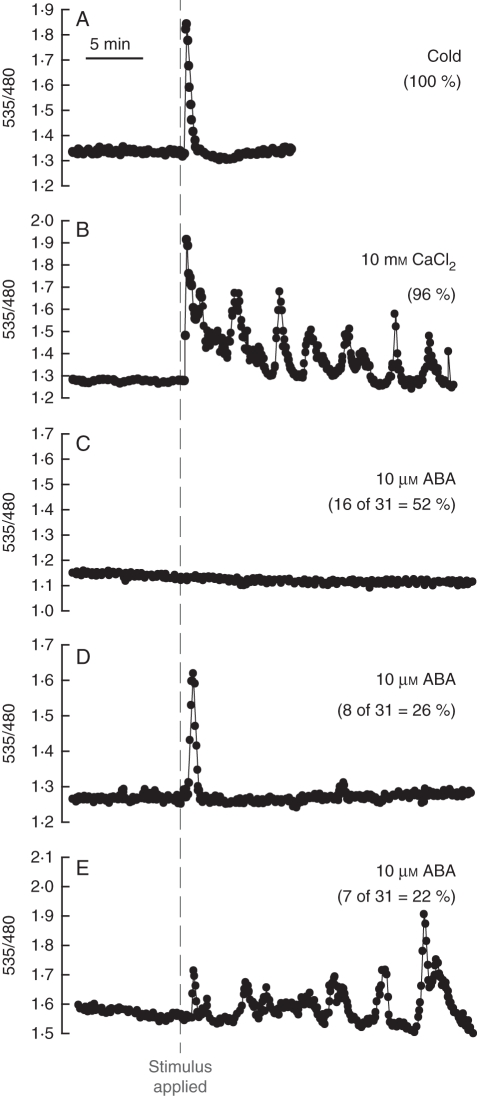
Fig. 2.
Stimulus-induced increases in guard cell [Ca2+]cyt. Plants transformed with the FRET-based Ca2+ sensor YC3·6, targeted to guard cells with the pGC1 guard cell promoter, were imaged (Allen et al., 1999b). Cells were initially incubated in a stomatal-opening buffer and then after 10 min of recording were challenged with (A) a cold shock (4 °C; n = 15), (B) 10 mm external CaCl2 (n = 26) or (C–E) 10 µm ABA (n = 31) as indicated. External [Ca2+] elevation induces oscillations in [Ca2+]cyt consistent with previous studies (McAinsh et al., 1995; Allen et al., 2000). The response to ABA was variable, with some cells showing no changes in [Ca2+]cyt and others exhibiting oscillations in [Ca2+]cyt in response to ABA under the imposed conditions (Allen et al., 1999b; Hugouvieux et al., 2001; Jung et al., 2002; Kwak et al., 2003), as discussed in the text. All traces are expressed as the ratio of recorded fluorescence emitted at 535 nm divided by fluorescence emitted at 480 nm after excitation at 440 nm as described in Allen et al. (1999b). Daily misting of plants with water was used to reduce endogenous ABA concentrations and increased the percentage of guard cells that showed ABA-induced [Ca2+]cyt elevation, as reported previously (Allen et al., 1999a,b). Epidermal peels were prepared from 3- to 5-week-old plants stably transformed with the cameleon construct according to the method described in Allen et al. (1999b). Samples were incubated in either a high-[K+] buffer (50 mm K+, 10 mm MES-Tris, pH 6·2) for cold and the indicated CaCl2 treatment (Fig. 2A, B) or stomatal-opening buffer (5 mm K+, 50 µm CaCl2, 10 mm MES-Tris, pH 6·2; ABA) for 3 h before imaging (C–E). Imaging was performed as described in Allen et al. (1999b). Cells were treated with either a cold shock (4 °C; n = 15), 10 mm CaCl2 (n = 26) or 10 µm ABA (dissolved in methanol). All traces were corrected for YFP bleaching through subtraction of the overall gradual decline in fluorescence in each channel from each data point (Allen et al., 1999b; Klüsener et al., 2002).

