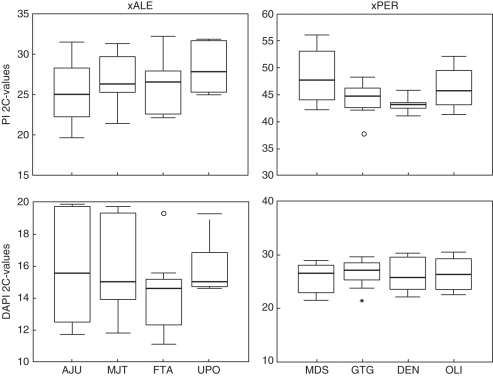
Fig. 3.
Intra-population variation of 2C values obtained for the natural hybrids N. × alentejanus (xALE) and N. × perezlarae (xPER). Top: genome size measured with PI. Below: genome size measured with DAPI. Values are expressed in pg. The horizontal line across the box represents the median, and the box represents the interquartile range that contains 50 % of the values. The whiskers are the lines that extend from the box to the highest and lowest values excluding outliers. Asterisks represent extreme values (cases with values more than 3 box lengths from the upper or the lower edge of the box) and open circles represent outliers (cases with values between 1·5 and 3 box lengths from the upper or the lower edge of the box).

