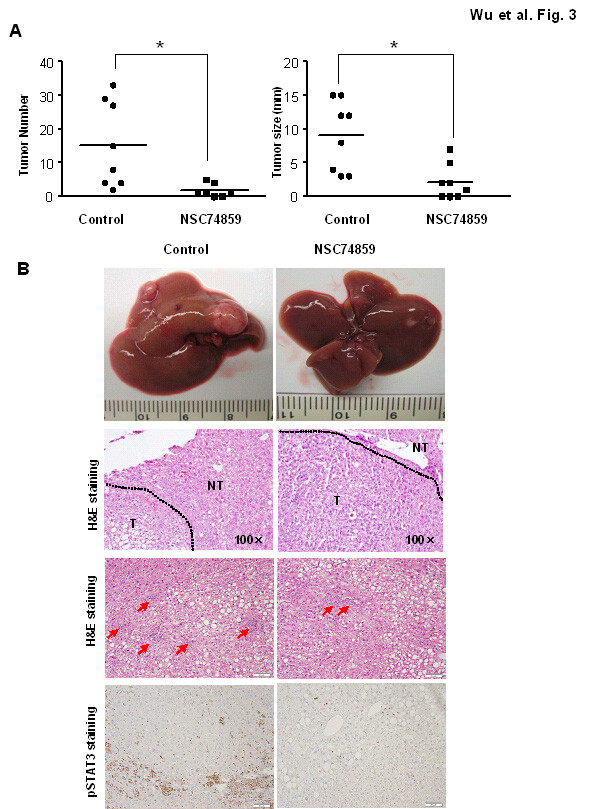
Figure 3.

NSC 74859 reduced DEN-induced liver tumorigenesis (a) The mice from control and NSC 74859 group treated with 5 μg/g of DEN at age 15 days and sacrificed post-DEN (8 mice per group). The number and size of tumors on surface were counted. (b) Representative images of livers, H&E staining, inflammation and pSTAT3 immunostaining are shown. T: tumor; NT: non-tumor tissues. The arrows in inflammation analysis indicate the inflammatory foci.
