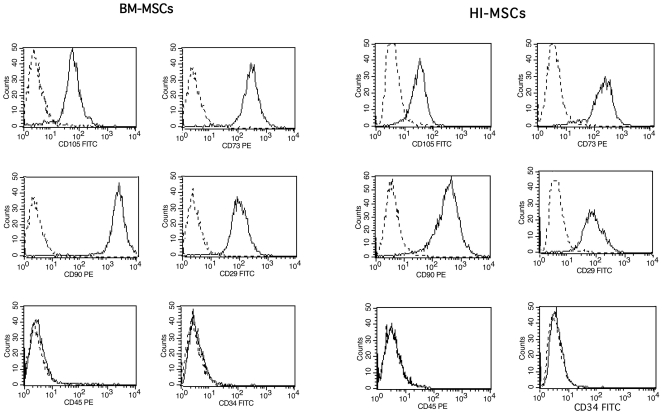
Figure 1. Characterization of BM and HI-MSCs.
Representative FACS analyses shows that BM and HI-MSCs were positive for surface marker characterization of MSCs (CD105, CD73, CD90, CD29), and were negative for specific hematopoietic markers (CD45 and CD34) Dotted line is the isotypic control. All cell lines were tested with similar results.

