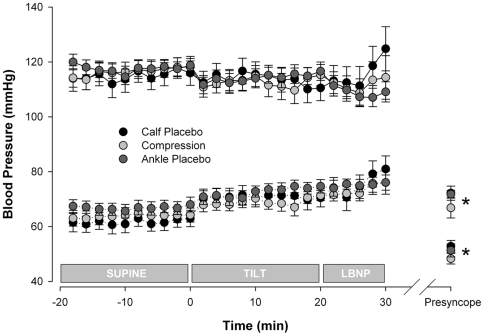
Figure 3. Blood pressure responses in the three test conditions.
Solid lines, systolic arterial pressures; dotted lines, diastolic arterial pressures. There were no significant differences in systolic or diastolic arterial pressures between test conditions at any time point. Values at presyncope were significantly reduced compared to supine in all conditions (* denotes p<0.01).

