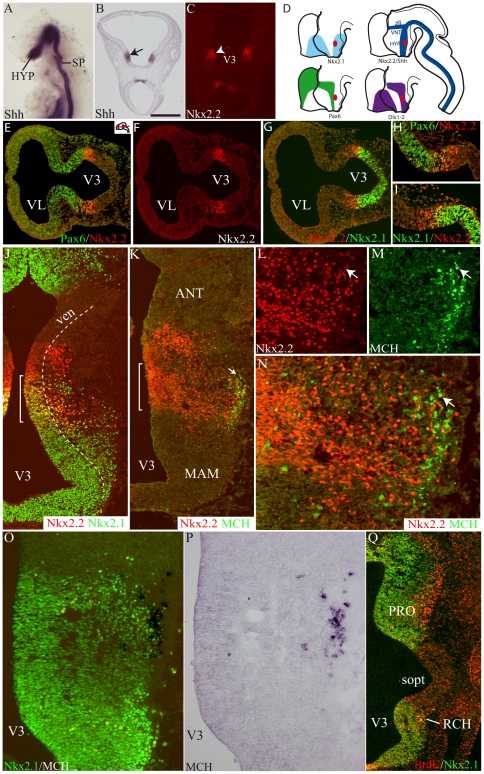
Figure 3. Differentiation of the MCH phenotype and regulatory gene expression patterns.
(A) Whole mount Shh in situ hybridization of an E9 mouse embryo. (B, C) Shh (in situ hybridization – arrow in B) and Nkx2.2 (immunofluorescence – arrowhead in C) on two E10 rat horizontal sections passing through the dorsal hypothalamus. The distribution of both genes is very similar in the diencephalon. (D) Diagrams summarizing the expression patterns of five regulatory genes and MCH (red area) in the prosencephalon. See text for additional details and Shimogori et al. (2010). (E–I) Using double immunofluorescence, distributions of Pax6, Nkx2.1 and Nkx2.2 on two adjacent horizontal sections of an E10 rat embryo. Pax6 and Nkx2.1 expression domains are contiguous. Both encroached upon the Nkx2.2 labeled tissue. (J–N) Photomicrographs to illustrate the immunohistochemical co-distribution of MCH, Nkx2.1 and Nkx2.2 at a low (J, K) or high (L–N) magnifications of a E14 rat embryo. MCH cell bodies are very lateral in the mantle layer (arrow in K) but they are restricted to the Nkx2.2/Nkx2.1 co-expressing region (brackets on J and K) in the dorsal and posterior hypothalamic region. Arrow in L–N points to a MCH/Nkx2.2 perikarya. (O–P) Co-distribution of MCH (in situ hybridization) and Nkx2.1 (immunofluorescence); most MCH neurons have a Nkx2.1 labeled nucleus. (Q) Double immunofluorescence labeling for BrdU (red) and Nkx2.1 (green) at E13. Both signals are intense in the preotic and retrochiamatic region. Scale bar: A, H, I, L, M, O, P = 250 µm; B, C = 300 µm; E–G, J, K, Q = 500 µm. ANT: anterior level, hypothalamus; HYP: hypothalamus; MAM: mammillary level, hypothalamus; PRO: preoptic level, hypothalamus; RCH: retrochiasmatic area; sopt: optic sulcus; SP: spinal cord; V3: third ventricle; ven: ventricular layer; VNT: ventral thalamus; zli: zona limitans intrathalamica.

