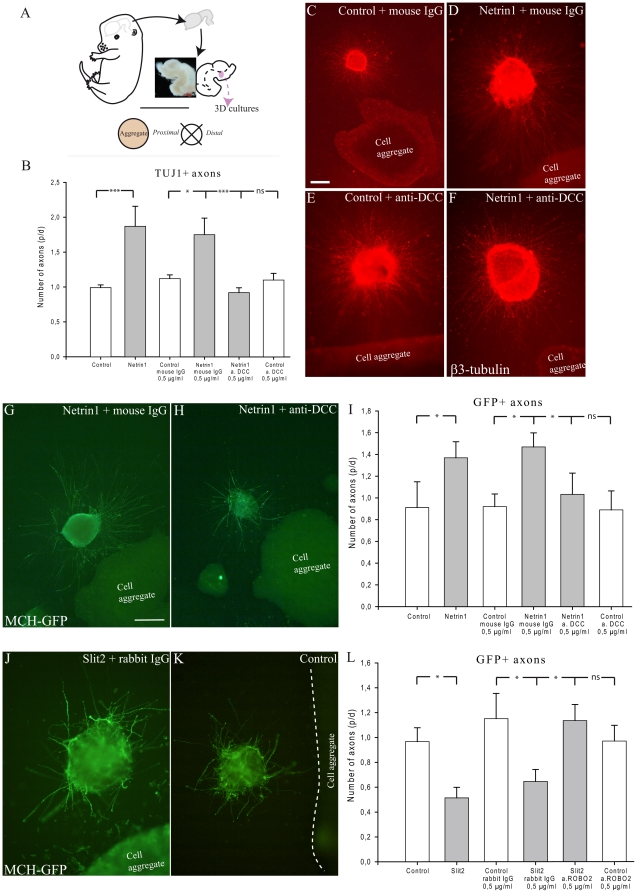
Figure 14. Netrin1 attracts and Slit2 repulses MCH axons.
(A) Tridimensional culture experiments. E16 embryonic brains were dissected out. The ventral midline was incised to expose the ventricular surfaces. Posterior hypothalamic regions were isolated, cut into 200 µm thick pieces and deposited around cell aggregates. Quantification was performed as follow: after two days in vitro, each explant was divided into four quadrants. TUJ1 or GFP positive fibers were counted in the proximal and distal quadrants. The ratio between proximal and distal (p/d) fiber number was then calculated for each explant. (B) Statistical analysis: caudal hypothalamic axons were significantly attracted by Netrin1-transfected cells aggregates, but not by control cells. Addition of an anti-DCC antibody blocks the effect of Netrin1 on axons. (C–F): Netrin1 attracts axons of caudal lateral hypothalamus. Aggregates of control or Netrin1-expressing HEK-293 cells were confronted to caudal hypothalamic explants containing interneurons. Axons growth is visualized with the TUJ1 (anti-β3 tubulin) antibody. Netrin1 exerts a clear attractive effect compared to control cases. This effect is abolished by incubation with the anti-DCC antibody. (G, H) Photomicrographs of two explants labeled by the GFP-AS and cultured cell aggregates expressing Netrin1and incubated with control IgG or anti-DCC IgG. Netrin1 attracts GFP axons, but this effect is inhibited by anti-DCC IgG (I) Statistical analysis: MCH-GFP axons are attracted by Netrin1 but not by controls. (J, K) Slit2 repelled MCH-GFP axons. Aggregates of control or Slit2-expressing HEK-293 cells were confronted to caudal hypothalamic explants containing interneurons. Axons growth is visualized with the GFP antibody. Slit2 exerts a clear repulsive effect compared to control cases. This effect is abolished by incubation with the anti-Robo2 antibody. (L) Statistical analysis: MCH-GFP axons are repelled by Slit2 but not by controls. Data indicate mean ±SEM. ***: p≤0,001; *: p≤0.05; n.s.: not significant, Mann Whitney's test. Scale bar (C–F): C = 200 µm; D–F = 400 µm; Scale bar (G, H, J, K): G, H = 200 µm; J, K = 400 µm.

