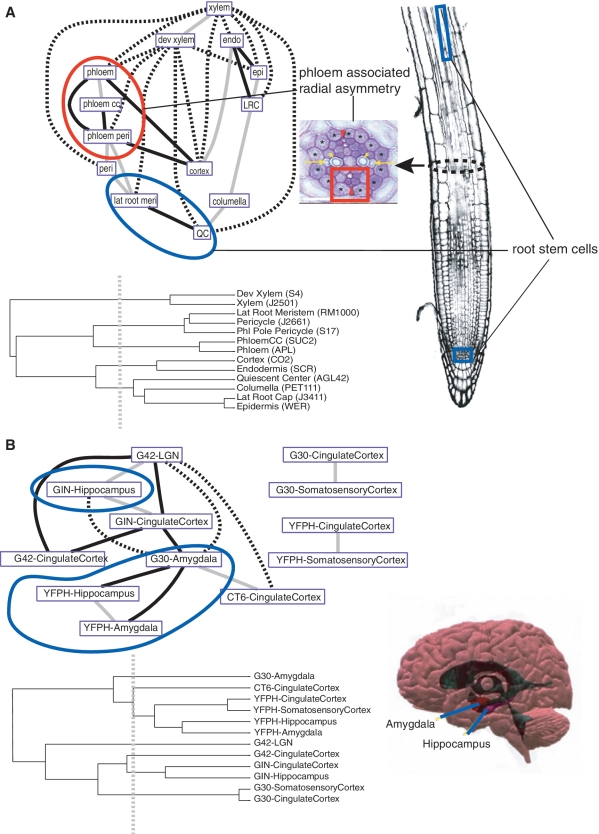
Figure 4.
Cell-type affinities in the Arabidopsis root and mouse brain. In Spec network representations, each edge represents a major pattern that linked the two cell types via a large number of genes (>100 genes in Arabidopsis; >50 genes in mouse) whose expression domains overlapped both cell types (see ‘Materials and Methods’ section). Dendrograms depict cell-type affinities using a similarity matrix of Pearson correlation of overall gene expression values. Gray edges in network represent cell types with high similarity in the tree where their ancestral node meets less than half the maximal distance. Black edges show cellular affinities that are distant in the similarity tree where their ancestral node meets at greater than half the maximal distance. Broken lines are longest distance relationships in the tree where their ancestral node is basal. (A) Phloem cells (red arrowheads) share a gene regulatory set (red circle) with adjoining pericycle cells (asterisks), showing a molecular domain of radial asymmetry (red square); radial asymmetry subfigure is reproduced from Figure 1b of (44); root subfigure was previously published in (3). QC cells, which support the growth of the primary meristem, share a strong affinity with lateral root meristem cells, which support the growth of lateral roots (blue circle). (B) Cells in the core of the limbic system of mouse, amygdala and hippocampus (blue circle), show strong affinities in the Spec network despite differences in the genetic background from which they came. In the similarity tree, some of the same cell types (e.g. amygdala cell samples) show distant relationships; brain subfigure is reproduced from http://stuff4educators.com/web_images/amygdala_hippocampus.jpg.

