Figure 7.
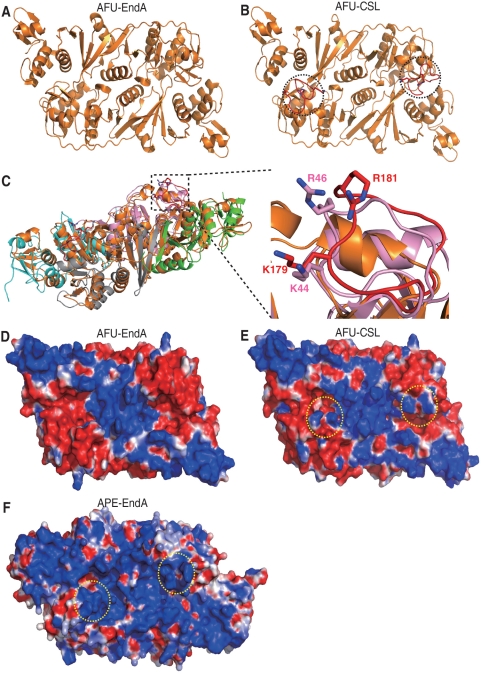
Structure of AFU-CSL. (A) Ribbon diagram of the overall structure of AFU-EndA (orange, PDB ID code 1RLV). (B) The crystal structure of AFU-CSL (orange). Two dotted circles indicate the inserted CSL (red). (C) Left: Superimposed structures of archaeal EndAs. The α-subunits of APE-EndA are indicated in pink and light grey. The β-subunits of APE-EndA are indicated in green and cyan. The α-subunits of AFU-CSL are in orange. Right: Close-up view of the structure of CSL region (red) of AFU-CSL (orange) superimposed on the structure of the corresponding region of APE-EndA (pink). The RMSD is 2.6 Å for 628 Cα atoms of AFU-CSL. (D) Electrostatic potential surface models of AFU-EndA: red and blue colors indicate negative and positive charges, respectively. (E) Electrostatic potential surface models of AFU-CSL. Two dotted circles (yellow) show the K179 and R181 residues of AFU-CSL. (F) Electrostatic potential surface models of APE-EndA. Two dotted circles (yellow) show the K44 and R46 residues of APE-EndA.

