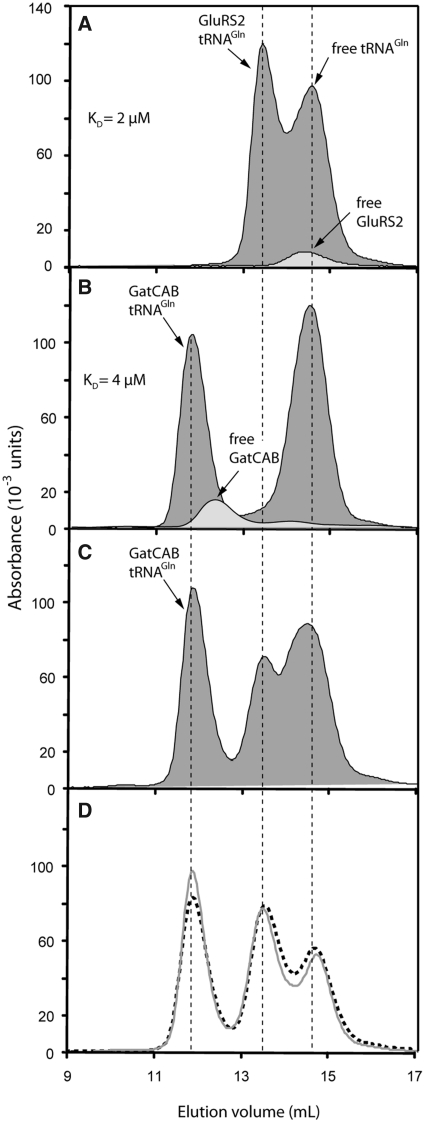
Figure 1.
Binding experiments with tRNAGln, GluRS2 and GatCAB as shown by size-exclusion chromatography. (A) Comparison of isolated GluRS2 and GluRS2/tRNAGln complex profiles. The association enabled us to estimate a KD value for GluRS2 and tRNAGln binding (see ‘Materials and Methods’ section). (B) Comparison between free and tRNAGln-complexed GatCAB. (C) Gel-filtration of a solution containing the three partners. (D) The same experiment as described in (C) was performed with preformed Glu-tRNAGln (grey line) or after incubation of the three partners within an aminoacylation medium containing free Glu and ATP, to provide endogenous Glu-tRNAGln (dotted line). Proteins and tRNAGln were added at concentrations of 20 µM each for the experiments shown in all panels.

