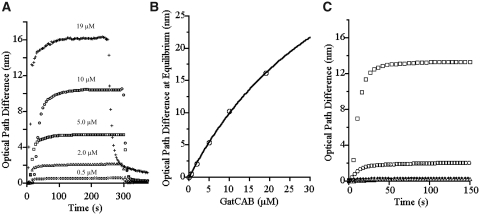
Figure 2.
GluRS2–GatCAB interactions characterized by optical interferometry. (A) Kinetics of association and dissociation of GatCAB to fixed GluRS2. GatCAB concentrations of 0.5, 2, 5, 10 and 19 µM yielded average optical path differences of 0.6, 2.2, 5.4, 10.4 and 16.2 nm at each plateau. The standard deviation of these averages was <1%. (B) Curve of GatCAB bound to GluRS2 at equilibrium (from A) versus the concentration of GatCAB in the mobile phase gives a KD of 40 ± 5 µM (standard error). The curve was obtained using the equation Y = L/(KD + L)·Ymax, where Y is the GatCAB bound at equilibrium, L is its concentration in the mobile phase and Ymax the maximum amount of GatCAB bound by the GluRS2 biosensor (26). (C) As controls, H. pylori GluRS1 was assayed against chip-bound GatCAB (open circle), chip-bound GluRS2 (filled diamond) and chip-bound GluRS1 (open triangle). GluRS1 concentrations of 10, 10 and 40 µM, respectively, were used as the target protein. Binding of GluRS1 with itself or with chip-bound GluRS2 was negligible relative to the ability of GluRS2 to bind to itself (open square). A small amount of GluRS1/GatCAB binding was detected (open circle) but this remained limited compared to the ability of GluRS2 to bind GatCAB (A).

