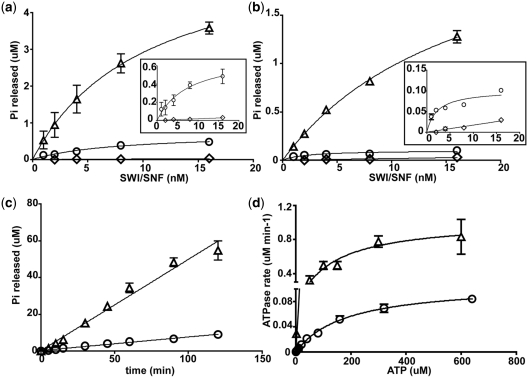
Figure 5.
The SnAC domain is necessary for efficient stimulation of the ATPase activity of SWI/SNF by nucleosomes or free DNA. (a) ATPase assays were done with fixed concentrations of γ-[32P]-ATP (8 µM) and 29N59 nucleosomes (8 nM). The reactions were incubated for 10 min and inorganic phosphate separated from ATP by thin layer chromatography on PEI-cellulose (33). SWI/SNF concentrations ranged from 1 to 16 nM. Reactions contained WT (open triangle) or ΔSnAC SWI/SNF (open circle) or WT SWI/SNF with no nucleosomes added (open diamond). Inset shows only ΔSnAC SWI/SNF with nucleosomes (open circle) and WT SWI/SNF with no nucleosomes added (open diamond) with an expanded y-axis. (b) Similar ATPase assays were done as in (a) except they contained 35 ng pUC18 DNA instead of 29N59 nucleosomes. Reactions contained WT (open triangle) or ΔSnAC SWI/SNF (open circle) or WT SWI/SNF with no DNA added (open diamond). Inset shows only ΔSnAC SWI/SNF with DNA (open circle) and WT SWI/SNF with no DNA added (open diamond) with an expanded y-axis. (c) The rate of ATP hydrolysis of WT (open triangle) and ΔSnAC SWI/SNF (open circle) with 320 µM ATP was measured with excess SWI/SNF (7.5 nM) relative to nucleosomes (2.5 nM). (d) The Km and Kcat values for ATP hydrolysis of WT and ΔSnAC SWI/SNF were found using 8 nM nucleosomes, 1.6 nM SWI/SNF, and ATP ranging from 0.2 to 640 µM. The Km and Kcat values were obtained by graphing initial rates of ATP hydrolysis versus ATP concentration as shown and performing non-linear regression analysis using GraphPad Prism.

