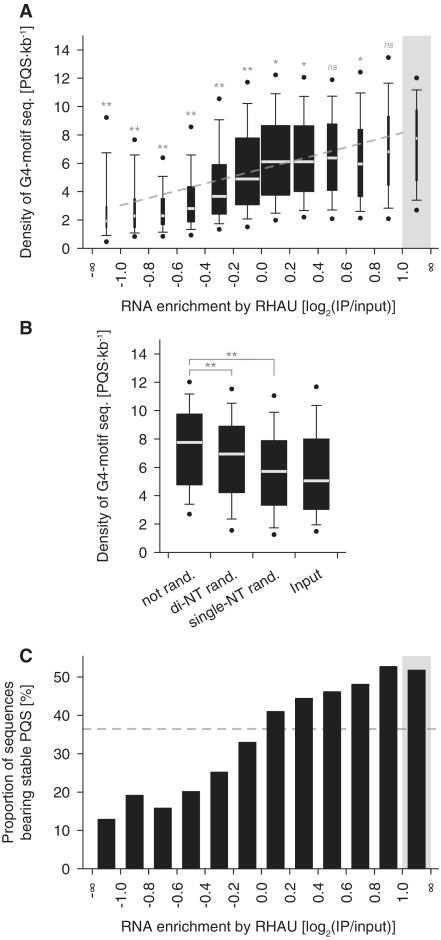
Figure 2.
Computational analysis of potential intramolecular G4-forming sequences (PQS) among RNAs enriched by RHAU. (A) Box plot representation of the density of potential intramolecular G4-forming sequences per transcript (PQS·kb−1) as a function of their level of enrichment by RHAU. The lower and upper boundaries of the boxes indicate the 25th and 75th percentiles, respectively. The white lines within the boxes mark the median. The width of the boxes is proportional to the number of transcripts found within a group. The error bars indicate the 10th and 90th percentiles and the filled circles the 5th and 95th percentiles. The grey rectangle refers to the group of 106 RNAs specifically enriched by RHAU and serves as a control group for multiple comparison analysis. Statistical significance was determined by Kruskal–Wallis one-way ANOVA on ranks and the Dunn’s test. nsP ≥ 0.05; *P < 0.05; **P < 0.01. The correlation between the two variables was estimated by linear regression analysis (y = 2.56x + 5.60, R2 = 0.10, P < 0.001) and is indicated as a grey line on the graph. (B) PQS analysis among randomized RHAU target sequences. The sequences of the 106 transcripts specifically enriched by RHAU were shuffled, retaining single- or di-nucleotide base composition of the original transcripts. The box plot represents the density of PQS (PQS·kb−1) among the original (not rand.), di-nucleotide shuffled (di-NT rand.) and single-nucleotide shuffled (single-NT rand.) sequences. Statistical significance was determined by one-way repeated measures ANOVA and the Dunnett’s test. (C) Proportions of RNAs bearing stable PQS as a function of their level of enrichment by RHAU. The grey rectangle refers to the group of 106 RNAs specifically enriched by RHAU. The dashed grey line denotes the proportion of sequences showing stable PQS in the input fraction. Significant (P < 0.001) association between the magnitudes of the two variables was estimated by the chi-square-test-for-trend.

