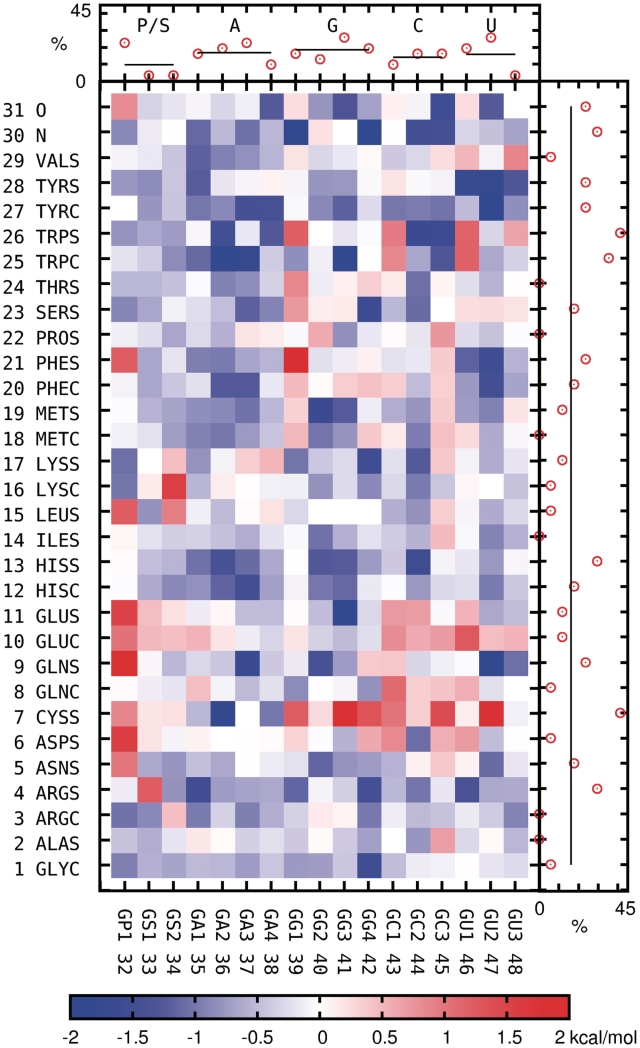
Figure 4.
Color map: average amplitudes—well depths (negative values) or saddle point heights (positive values)—of interaction potentials for all bead pairs. Side plots: the percentage of strong interactions for each bead; strong interactions are defined as having an amplitude higher than average plus 1 SD.

