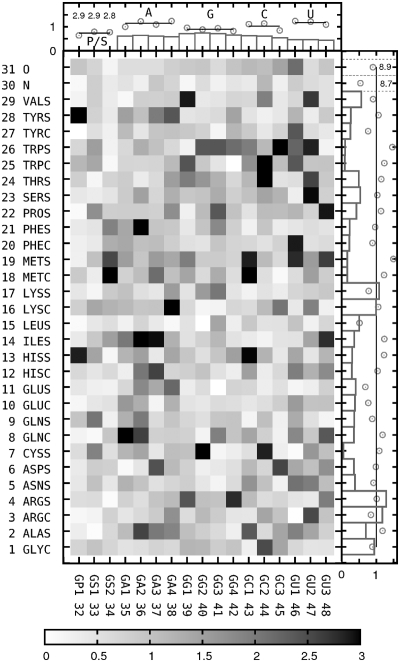
Figure 5.
Deviations of minimum or saddle point locations for three sets of pairwise potentials with respect to consensus set. Side plots: average deviations for each pseudoatom type (points), relative frequencies of pseudoatoms found in interacting pairs (histograms). All data normalized such that average values equal one.

