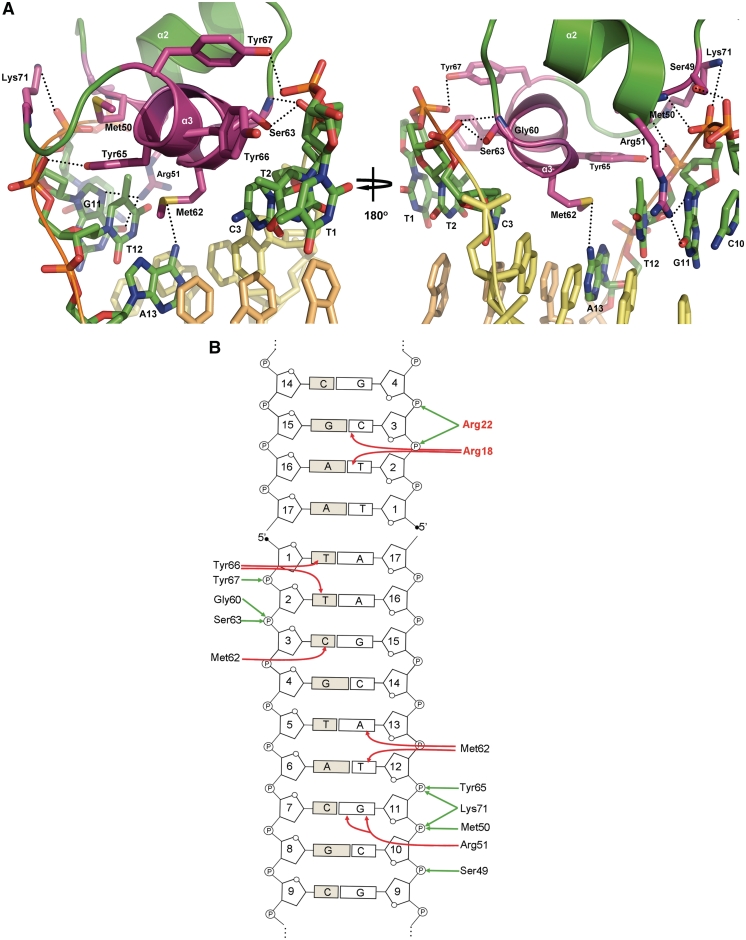
Figure 5.
(A) Interactions between the HTH motif and the major groove. Stick representations of the interacting residues are shown in magenta. The Cα backbone of recognition helix α3 is shown in magenta and that of helix α2 is shown in green. Hydrogen bonds are represented by dotted black lines. The interacting bases are labelled and only the ring frames are shown for non-interacting bases. (B) Schematic representation of SimR–DNA contacts. For simplicity, only a recognition half-site and the first 4 bp of an adjacent duplex are shown. Interactions between amino acid residues and the bases of the cognate DNA operator are indicated by red arrows, and those between amino acid residues and the phosphate backbone are represented by green arrows. Amino acid residues belonging to the TFR arm are shown in red.

