Figure 6.
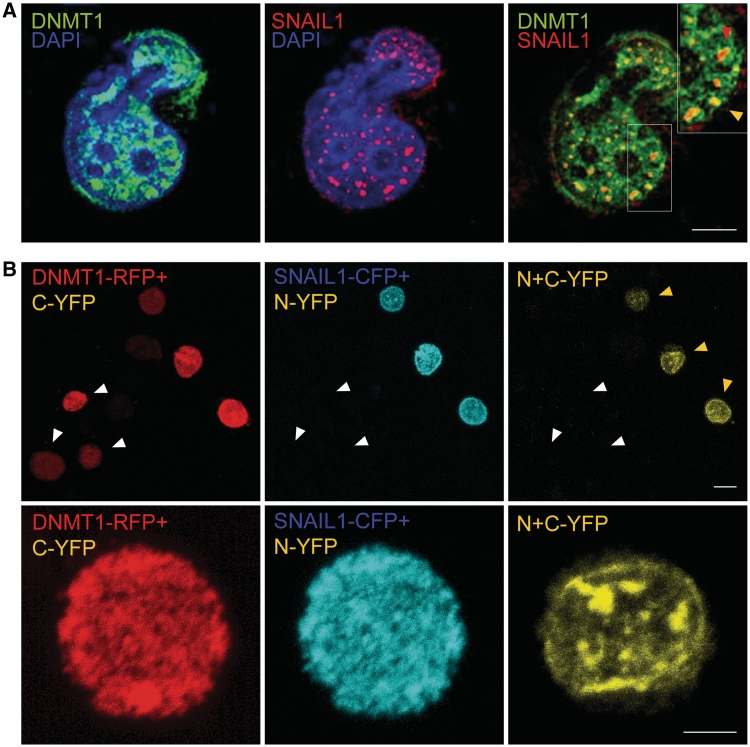
DNMT1 and SNAIL1 can interact in the cell nucleus. (A) Direct immunofluorescence analysis of the colocalization of SNAIL1 and DNMT1 in the nucleus of HCT116 cell. SNAIL1 (red signal) is distributed in discrete spots in the cell nucleus, and colocalizes with DNMT1 (green signal; arrow) in specific locations (yellow signal; arrow heads). The insert shows an enlarged view of the area of the region demarcated by the white square. Images are of 0.1-μm-thick sections in the z-plane obtained by confocal microscopy. Bar: 5 μm. (B) Extended biomolecular fluorescence complementation assays (ExBiFC) to demonstrate the interaction of DNMT1 and SNAIL1 in the cell nucleus. DNMT1 was tagged with red fluorescent protein (RFP) fused to the C-region of the yellow fluorescent protein (C-YFP) while SNAIL1 was tagged with cyan fluorescent protein (CFP) fused to the N-region of YFP (N-YFP). Both constructs were expressed in HCT116 cells. Interaction of DNMT1-RFP and SNAIL1-CFP entailed the association of C- and T-regions of YFP and was revealed by the yellow emission of the whole protein. Upper panels: Only cells expressing DNMT1-RFP+C-YFP and SNAIL1-CFP+N-YFP showed the emission of N+C-YFP (yellow arrowheads). Cells expressing DNMT1-RFP+C-YFP but not SNAIL1-CFP+N-YFP did not show yellow emission (white arrowheads). Bars: 10 μm. Lower panels: Enlarged images showing cells expressing DNMT1-RFP+C-YFP and SNAIL1-CFP+N-YFP. Both tagged proteins showed a homogeneous distribution pattern in the cell nucleus. In contrast, the yellow emission corresponding to the N+C-YFP fusion was located in discrete regions of the nuclear compartment. Bars: 5 μm.

