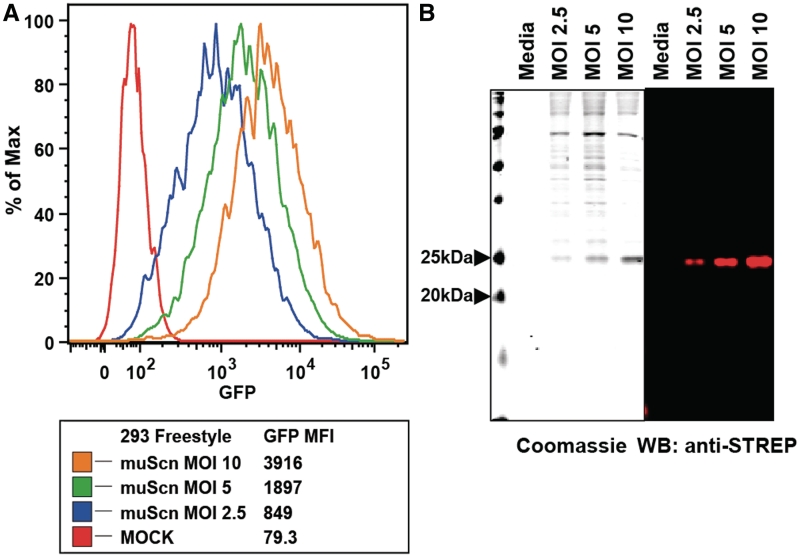
Figure 2.
Transduction of 293-F cells at varying multiplicity of infection (MOI). (A) GFP MFI (mean fluorescence intensity) is shown for three different doses of pCVL-SFFV-muScn-IRES-GFP virus. (B) Analyses of expression of levels of muScn are shown; 20-µl aliquots from media supernatants from each transduction were separated by SDS–PAGE and stained with Coomassie blue (left) or analyzed by western blot with an anti-Strep II tag antibody (right).

