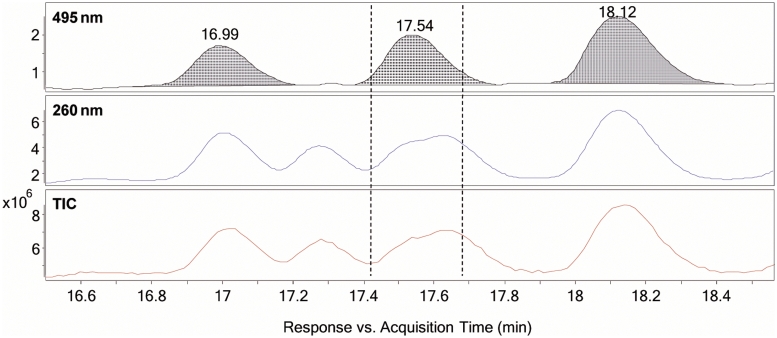
Figure 9.
Zoomed view of Figure 7 (16.6–18.5 min) illustrating FITC-labelled and non-FITC-labelled fragments co-eluting. The extracted wavelength chromatogram at 495 nm shows FITC-labelled nucleic acid fragments, the extracted wavelength chromatogram at 260 nm indicates all nucleic acid fragments (labelled and non-labelled) and the TIC displays all ions in the sample material. It is clear to see that in the marked area between the dotted lines there are other species present that produce ions alongside the labelled fragment with the retention time of 17.54 min.

