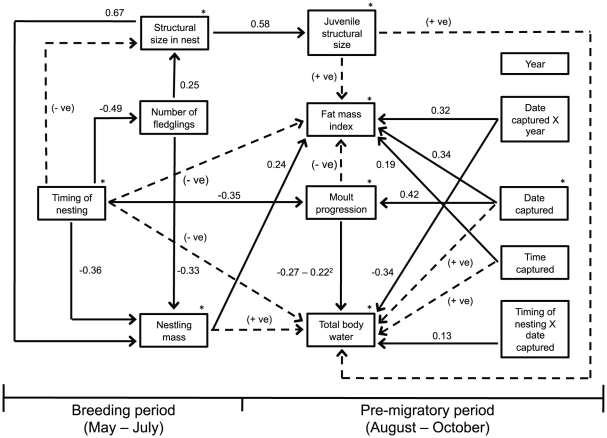
Figure 1. Path model illustrating relationships between natal history and pre-migratory body condition.
Solid black arrows represent significant relationships. Numbers associated with each solid line represent standardized path coefficients. The asterisks indicate significant year effects. Hatched lines represent hypothesized causal relationships that were not statistically significant (P>0.05). The sign inside the parentheses associated with each hatched line represents the predicted direction of the relationship.

