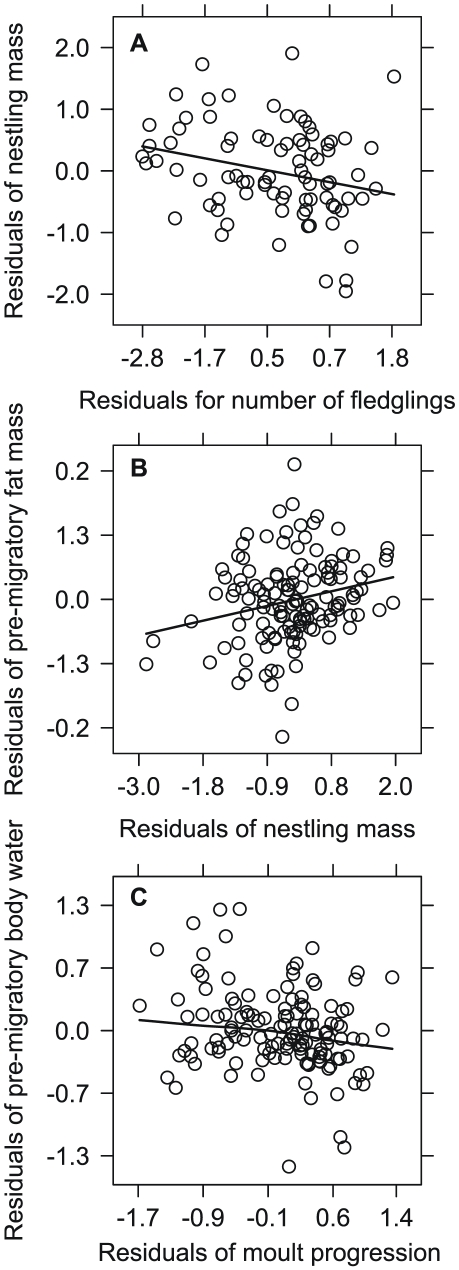
Figure 4. Partial regression plots depicting factors affecting body condition.
Panels illustrate: (A) negative relationship between nestling mass with number of fledglings, (B) positive relationship between fat mass and nestling mass, and (C) negative curvilinear relationship between total body water and moult progression. Trends illustrated with locally weighted regression lines.

