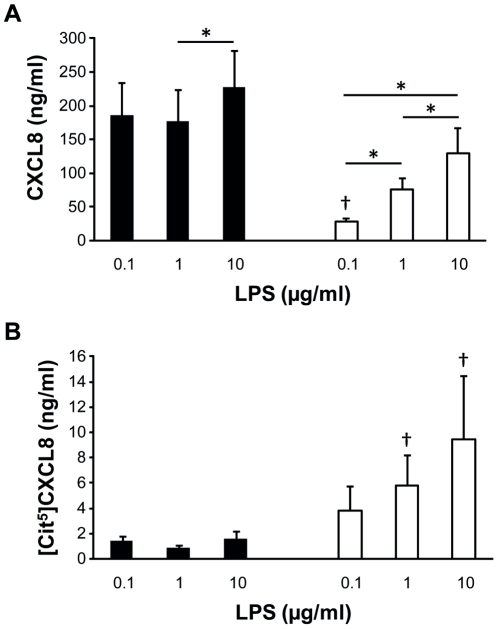
Figure 7. Effect of LPS on the induction of total CXCL8 and [Cit5]CXCL8 in PBMCs and granulocytes.
PBMCs (black) and granulocytes (white) were induced with 0, 0.1, 1 and 10 µg/ml LPS and cell culture supernatants harvested after 24 h. CXCL8 and [Cit5]CXCL8 concentrations were measured by ELISA and the newly developed antibody-based method, respectively. Results represent the mean concentration of CXCL8 (Panel A) and [Cit5]CXCL8 (Panel B) in ng/ml (seven independent experiments on cells from different donors). Statistical comparison between production levels of CXCL8 and [Cit5]CXCL8 was performed using the Wilcoxon matched pairs test (* p<0.05 for comparison within a leukocyte subgroup and † p<0.05 for comparison with PBMCs induced with the same dose of LPS).

