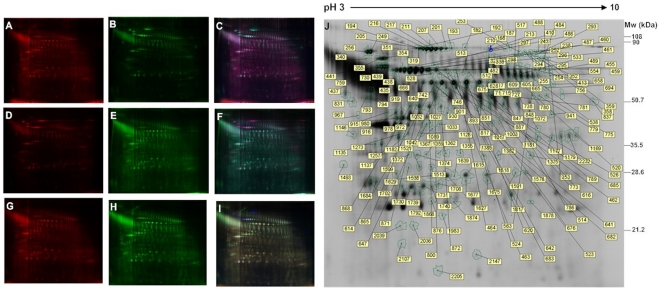
Figure 1. Differentially expressed protein spots shown in 2DE DIGE image.
Samples prepared from aging oocytes (A, H), caffeine treatment (B, D) and MII oocytes (E, G) were labeled with Cy3 or Cy5 separately, and images were emerged by software. (C, F, I) the blue spots are internal standard proteins consisting of all samples labeled with Cy2. (J) the significantly up-regulated and down-regulated protein spots in the aging group and aging with caffeine group.

