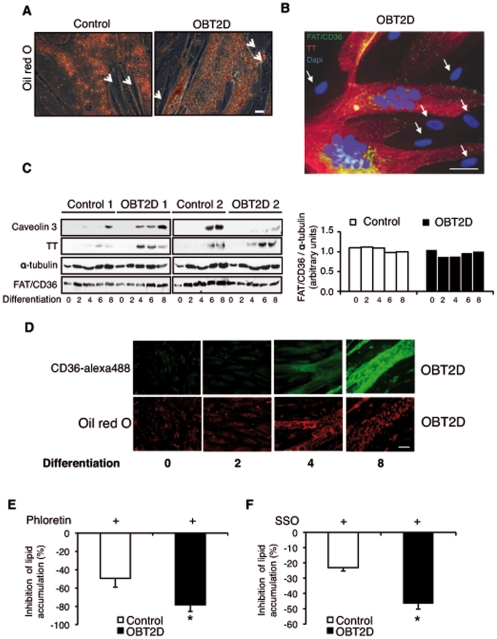
Figure 2. Increased membrane localization of FAT/CD36 during differentiation is responsible for increased lipid accumulation in OBT2D myotubes.
A. Representative light microscopy of myotubes derived from control subjects (Control) or obese type 2 diabetic patients (OBT2D), after 8 days of differentiation, stained by oil red O after palmitate treatment (0.6 mM for 16 h). The 4 Control and the 5 OBT2D cells showed a staining similar to the representative pictures. Arrows show reserve cells. Scale bar represents 30 µm. B. Merged picture of FAT/CD36 (H300), troponin T (TT) and dapi staining in OBT2D differentiated cells (for 8 days). Living cells were incubated for 1 h with an antibody against FAT/CD36 (H300, left panel) and for 1 h with a polyclonal secondary antibody conjugated to alexa 488 (green). After fixation and permeabilization, cells were incubated with an antibody against troponin T (TT) visualized using a secondary monoclonal antibody conjugated to alexa 546 (red). The 5 OBT2D cells showed a staining similar to the representative pictures. Arrows show reserve cells. Scale bar represents 30 µm. C. Left panel: Western blot analysis of the expression of total FAT/CD36 in proliferative (0), and after 2, 4, 6 and 8 days of differentiation of cells established from two control subjects (Control 1 and 2) and two obese type 2 diabetic patients (OBT2D 1 and 2). Troponin T (TT) and caveolin 3 were used as markers of myotube differentiation and α-tubulin as a loading control. Right panel: quantification by density analysis of the 2 controls and the 2 OBT2D. Data are presented normalized to α-tubulin protein expression where the value of Control cells after 8 days of differentiation has been arbitrary chosen as the reference value equal to 1. D. Representative immunofluorescence microscopy of cells established from obese type 2 diabetic patients (OBT2D) in proliferative (0), and after 2, 4 and 8 days of differentiation, treated by palmitate (0.6 mM for 16 h), incubated for the last hour with CD36-alexa488 antibody (green) and stained by oil red O (red) after fixation. The 5 OBT2D cells showed a staining similar to the representative pictures. Scale bar represents 30 µm. E. Percentage of inhibition of lipid content in Control (n = 4) and in OBT2D differentiated satellite cells (n = 5) after phloretin stimulation (400 µM for 30 min) followed by palmitate treatment (0.6 mM for 16 h). Data are means ±SEM. Each point was assayed in triplicate for each of the 9 independent cell cultures. *, p<0.05, OBT2D versus Control cells. F. Percentage of inhibition of lipid content in Control (n = 4) and OBT2D differentiated satellite cells (n = 4) after SSO stimulation (250 µg/ml for 30 min) followed by three PBS washes and by palmitate treatment (0.6 mM for 16 h). Data are means ±SEM. Each point was assayed in triplicate for each of the 8 independent cell cultures. *, p<0.05, OBT2D versus Control cells.

