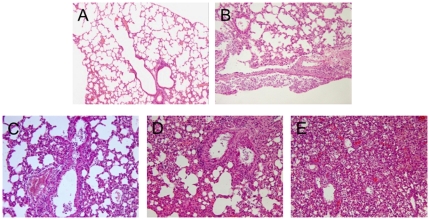
Figure 4. Histological analysis of the lung tissues.
The collected lung tissue samples from each group of mice at 4 d.p.i. were subjected to routine histological process and the tissue sections were stained with H&E. Data show are representative images (magnification ×100) of each group of mice (n = 10 per group). (A) The lung tissue section from PBS mock infected mice; (B) The lung tissue section from the mice infected with WT virus; (C) The lung tissue section from the mice infected with MA-2 virus; (D) The lung tissue section from the mice infected with MA-3 virus; (E) The lung tissue section from the mice infected with MA-8 virus.

