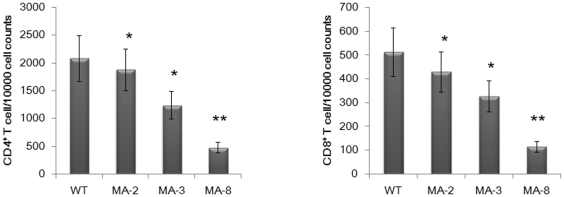
Figure 6. The frequency of peripheral blood CD4+ and CD8+ T lymphocytes.
Peripheral blood samples were obtained from individual mice at 4 d.p.i and their PBMC were prepared. Subsequently, those PBMC were stained with fluorescent anti-CD4 or anti-CD8 and the frequency of CD4+ and CD8+ T cells were determined by flow cytometry analysis. Data are expressed as mean ± SD of percentages of CD4+ or CD8+ T cells in each group of mice (n = 10 per group) from three separate experiments. * P<0.05 and ** P<0.01 vs. the values in the mice infected with wild type virus.

