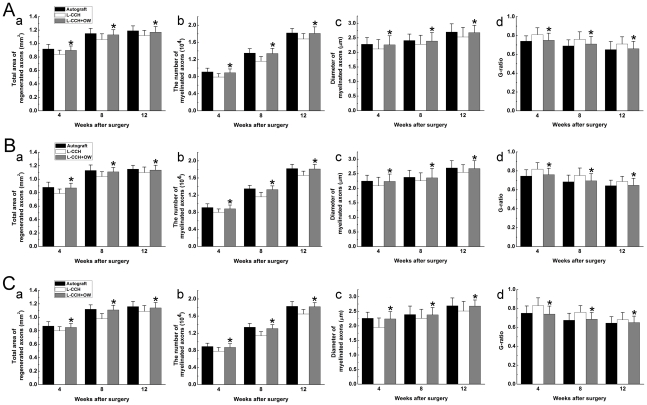
Figure 6. Morphometric evaluations of regenerated nerves.
A: the proximal portion; B: the middle portion; C: the distal portion. The cross-sectional area of regenerated nerve [A(a)–C(a)], quantification of the myelinated axons [A(b)–C(b)], the diameter of myelinated axons [A(c)–C(c)], and the G-ratio [A(d)–C(d)]. All data are expressed as the mean ± standard error of mean. *P<0.05 for the comparison with the L-CCH group.

