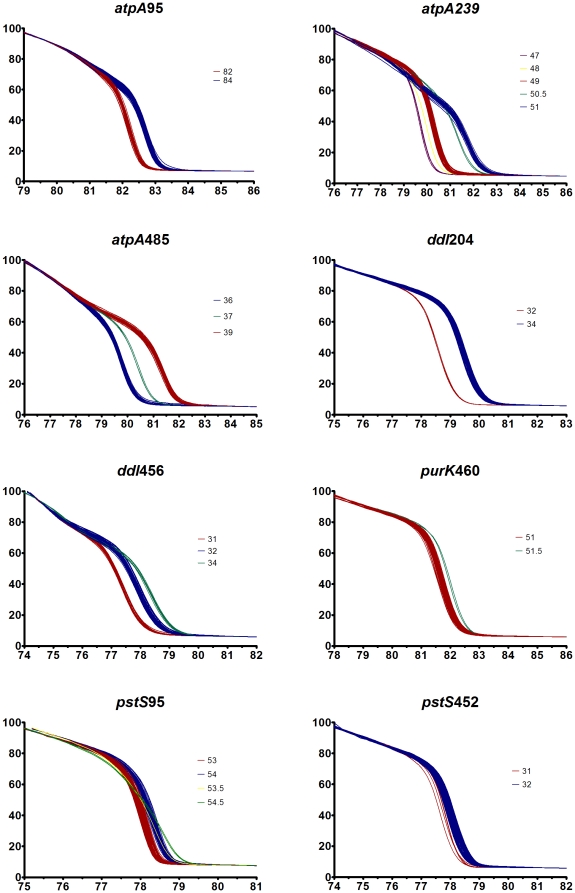
Figure 1. High-resolution melting curves for the eight fragments.
The normalized fluoresence (y-axis) is plotted against temperature in °C (x-axis) and shows the curves for 85 E. faecium isolates. Each graph is labelled with the amplified SNP and combines two HRM runs that have been calibrated against each other; different curves are represented by a different color and accordingly labelled.

