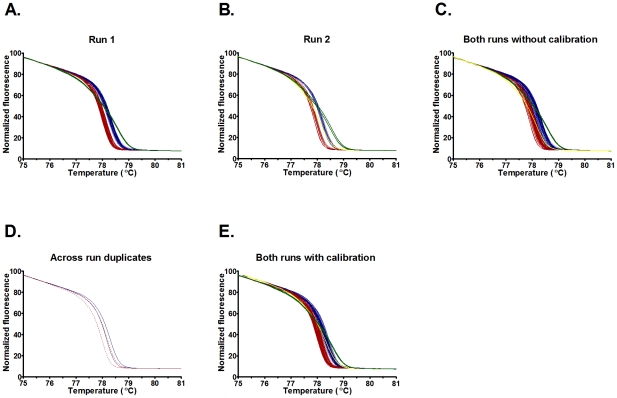
Figure 2. High-resolution melting curves for pstS95.
The graphs represent (A and B) HRM curves for two separate runs demonstrating discrimination of curves 53 (red) and 54 (blue) when each run is considered separately; (C) raw data from both runs combined without calibration, demonstrating an inability to discriminate curves 53 and 54; (D) raw data from two isolates included in both runs (solid red and dashed red lines for curve 53 isolate and solid blue and dashed blue for curve 54 isolate) demonstrating a shift in the curves when runs are compared without callibration; (E) data from both runs combined with calibration demonstrating discrimination of curves 53 and 54.

