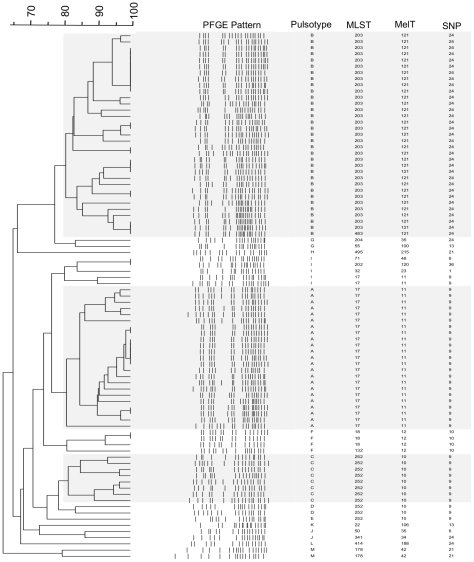
Figure 4. PFGE dendrogram of 85 isolates.
Dendrogram of pulsed-field gel electrophoresis clusters (major clusters highlighted by grey shading) with corresponding multilocus sequence types (MLST), melting types (MelTs) and in silico determined single nucleotide polymorphism types (SNP types). PFGE clusters are based on 80% similarity.

