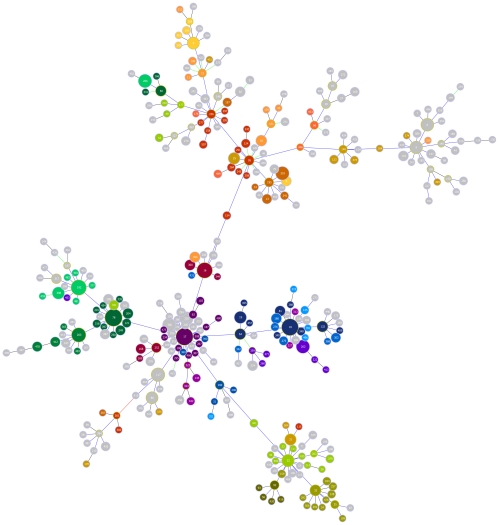
Figure 5. goeBURST diagram of the Enteroccocus faecium clonal complex 17 population.
goeBURST diagram of the Enteroccocus faecium clonal complex 17 population from the multilocus sequence type (ST) database with superimposed melting types (MelTs). The top 26 MelTs (each with ≥5 associated STs) are represented by different colors. Other STs in grey are represented by smaller MelTs that each have <5 associated STs. STs are indicated by numbers in the circles, the size of each circle represents the relative abundance of that ST, and lines indicate single locus variants.

