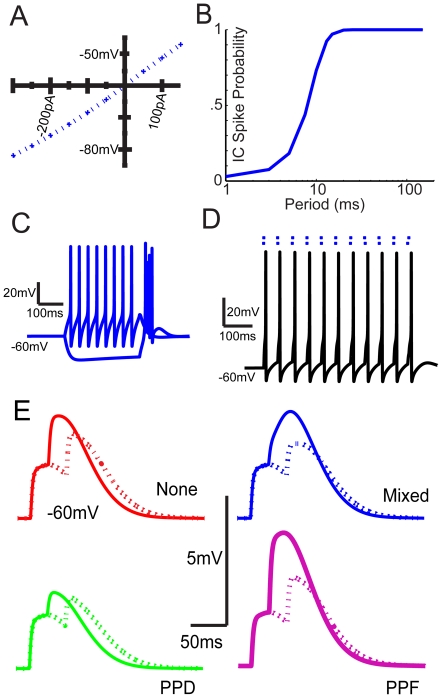
Figure 1. Intrinsic and Synaptic model characteristics.
A, I-V plot of model responses to current injections. B, IC Input spike probability as a function of inter-click interval. Spike probabilities are close to 1 at high inter-click intervals greater than 25 ms and fall as inter-click intervals are reduced. C, Model responses to 300 pA and -300 pA current injection, which produces a tonic firing response and an offset burst response, respectively. D, Example voltage trace observed from a single trial model simulation. The dots above indicate the 2 individual spike inputs used to produce the voltage response. E, Voltage traces show paired synaptic inputs having interclick interval of 25 and 50 ms. Solid lines are paired EPSPs with 25 ms ICIs and dashed lines are traces with 50 ms ICIs. From top to bottom, left to right: Modeled paired synaptic inputs with no plasticity, AMPA and NMDA exhibiting paired pulse depression (PPD), “Mixed” inputs with AMPA exhibiting depression and NMDA exhibiting facilitation, AMPA and NMDA inputs exhibiting paired pulse facilitation (PPF).

