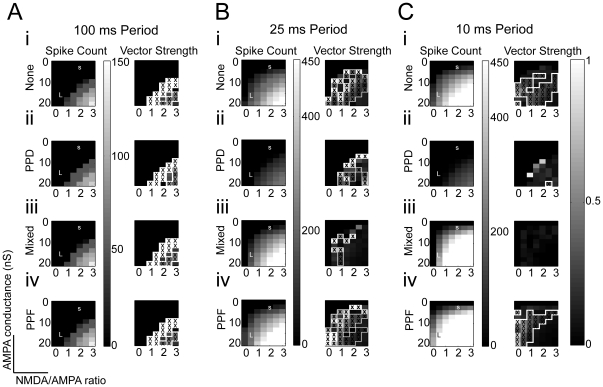
Figure 2. Model response characteristics produced as a result of adjusting AMPA and NMDA conductance levels.
Y-axis values correspond to AMPA conductance (0 – 20 nS), X-axis values correspond to ratio of NMDA to AMPA conductance (0, .5, 1, 1.5, 2, 2.5, 3). Values of AMPA conductance and NMDA:AMPA ratio chosen for Large and Small IC inputs are identified by a white L and S on the 100 ms color plots, respectively. Regions outlined in white indicate regions where response is statistically calculated to be synchronized (Rayleigh statistic >13.8, p<0.001). As ISIs decrease, the regions of synchronized responses diminish. A, i-iv: Spike rates and vector strength plots for 10 simulation trials at 100 ms interclick intervals, 500 ms duration each trial. From top to bottom: Spike rate and vector strength plots for no plasticity, short-term depression, mixed (AMPA depression + NMDA facilitation), and short-term facilitation do not vary much at large ISIs. B, i-iv: Spike rates and vector strength plots for 10 simulation trials at 25 ms interclick intervals. Synaptic facilitation increases spike rate, while synaptic depression decreases overall spike rates. C, i-iv: Spike rates and vector strength plots for 10 simulation trials at 10 ms interclick intervals. Short-term plasticity greatly affects overall spike rate. With the exception of one conductance pair in the PPD case, regions of synchronized responses only occur in simulations with no plasticity or synaptic facilitation.

