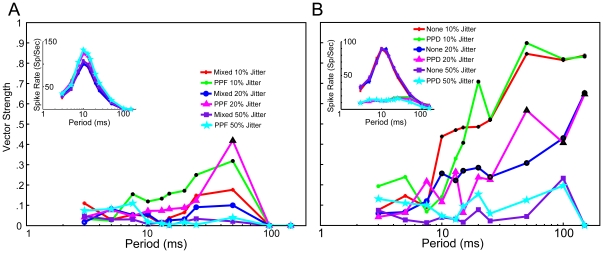
Figure 3. Large jitter values relative to period length desynchronize model responses.
A, Vector strength plot for 4 Small inputs exhibiting AMPA synaptic depression and NMDA synaptic facilitation (Mixed) or AMPA and NMDA facilitation (PPF). Red dots, blue circles and purple squares indicate Mixed input responses with jitter scaled to 10%, 20% and 50% of ICI, respectively. Green dots, pink triangles, and blue stars indicate PPF input responses with jitter scaled to 10%, 20% and 50% of ICI, respectively. Synchronized responses are found in the PPF case with 10% and 20% jitter at ICIs indicated with black symbols. Inset: Spike rates for the parameters described in A. Changes in jitter had little effect on spike rates in the PPF and Mixed case. B, Vector strength plot for 2 Large inputs, exhibiting either synaptic depression (PPD) and no plasticity (None). Red dots, blue circles and purple squares indicate “None” input responses with jitter scaled to 10%, 20% and 50% of ICI, respectively. Green dots, pink triangles, and blue stars indicate PPD input responses with jitter scaled to 10%, 20% and 50% of ICI, respectively. Vector strength increases with reduced jitter, as do the regions of synchronized activity (indicated with black symbols) Inset: Rate curves of the parameters described in B. Changes to input jitter do not affect spike rate curves.

