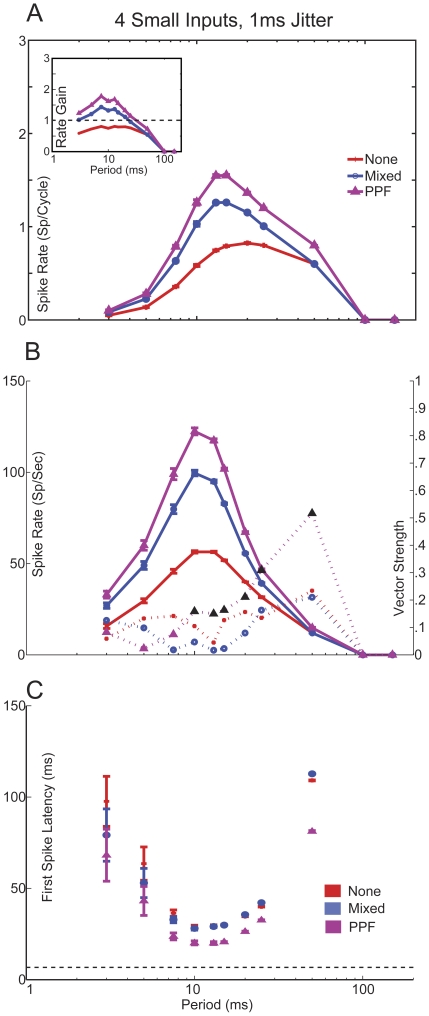
Figure 5. Small inputs exhibiting either PPF of Mixed plasticity produce band-pass, non-synchronized responses.
A, Spike rate curves from simulations using 4 Small inputs with 1 ms jitter. Rates are given in spikes/cycle. Simulations with PPD produced subthreshold activity. Inset: Rate gain curves calculated from model spike rates and input spike times. Spike rates do not change with plasticity at ICIs≥100 ms. Purple lines with triangles mark PPF, blue lines with circles indicate Mixed, and Red lines with plus symbols indicated no synaptic plasticity. B, Spike rate (solid lines) and vector strength (dashed lines) curves of 4 Small inputs. Synchronized responses were only found in the PPF case between 10 and 50 ms ICI, marked in black symbols. C, FSL curves for Small None, Mixed and PPF inputs. Dashed line shows FSL curve of 2 Large PPD inputs for comparison. Subthreshold responses were observed at ICIs≥100 ms and therefore no FSL was measured. FSL values reduced with ICI until a minimum is reached at an ICI of 10 ms, after which FSL increases due to decreased input spike probability.

