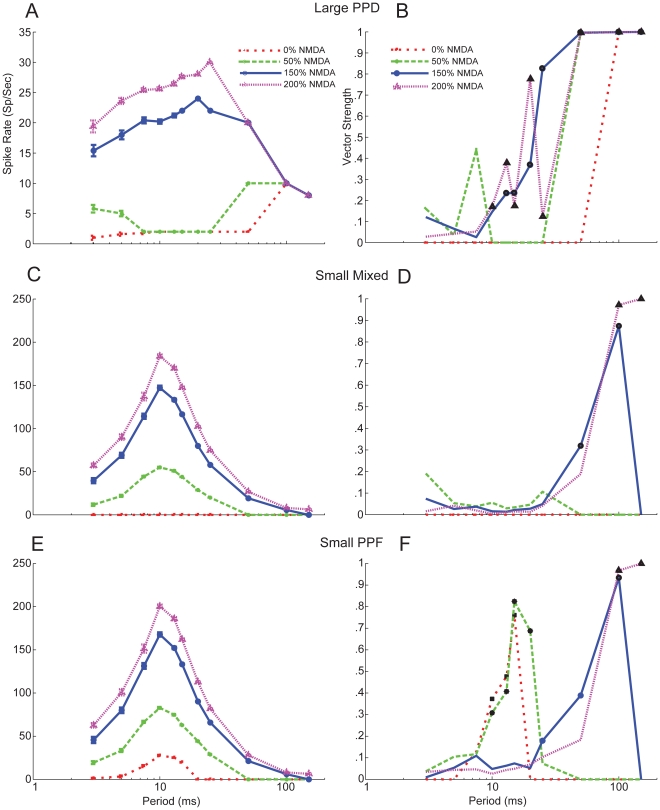
Figure 6. Reduction of NMDA receptor mediated current shifts responses rates and synchronization regions.
A, Model rate responses for 2 Large PPD Inputs with 1 ms jitter. Red lines show 0% NMDA, green lines show 50%, blue lines show 150% and purple lines show 200% NMDA. B, Vector strength curves for the same parameters as in A. Reduced NMDA reduces regions of spiking, which occurs at high ICIs where the effects of synaptic depression diminishes or at low ICIs where summation of EPSPs may occur. At low ICIs, typically only an onset response is observed followed by weak sustained or subthreshold activity. Synchronized responses are indicated with black symbols. C, Model rate responses for 4 Small Mixed Inputs with 1 ms jitter. Colors and symbols indicate percent of NMDA conductance used as described in A. D, Vector strength curves for the same parameters as in C. Synchronized responses are found only at high ICIs with increased NMDA. E, Model rate responses for 4 Small PPF Inputs with 1 ms jitter. F, Vector strength curves for the same parameters as in E. Although high vector strength values are observed at ICIs≥100 ms for trials with increased NMDA, these responses produce small spike rates and were not found to be synchronized. Reduced NMDA does produce synchronized responses between ICIs of 10 – 20 ms.

