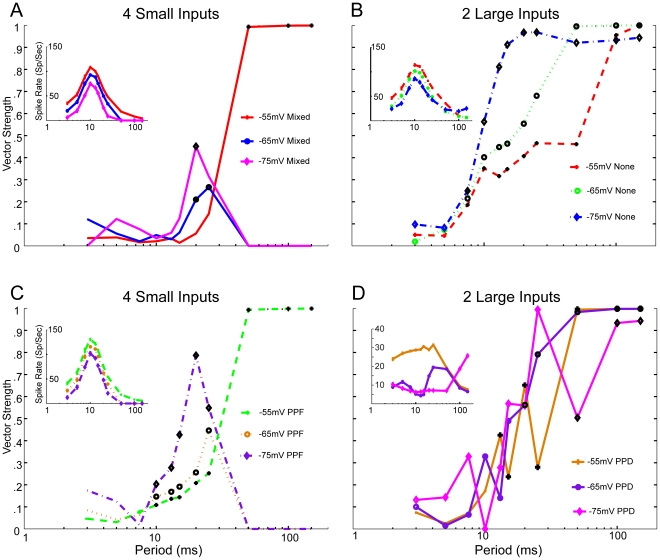
Figure 7. Changes in membrane potential affect response rates and synchronization boundaries.
Plus, circle and diamond symbols indicate simulations run at -55 mV, -65 mV, and -75 mV, respectively. A, Vector strength responses for trials using 4 Small Mixed inputs with 1 ms jitter. At -55 mV, synchronized responses were observed at ICIs≥50 ms. At more hyperpolarized membrane potentials, responses at these ICIs were subthreshold. Synchronized responses are observed at 20 – 25 ms. Inset: Spike rate responses for parameters used in A. At more depolarized membrane potentials, response rate is elevated. At hyperpolarized membrane potentials, rate is reduced. B, Vector strength responses for trials using 2 Large inputs and 1 ms jitter without synaptic plasticity. Synchronized responses were found at ICIs≥8.5 ms at all membrane potentials. Inset: Spike rate responses for B. C, Vector strength responses for 4 Small PPF Inputs with 1 ms jitter. Responses are synchronized at ICIs between 10 – 25 ms at all membrane potentials used. At -55 mV, synchronized responses are found at ICIs≥50 ms. At these ICIs responses are subthreshold at -65 and -75 mV.

