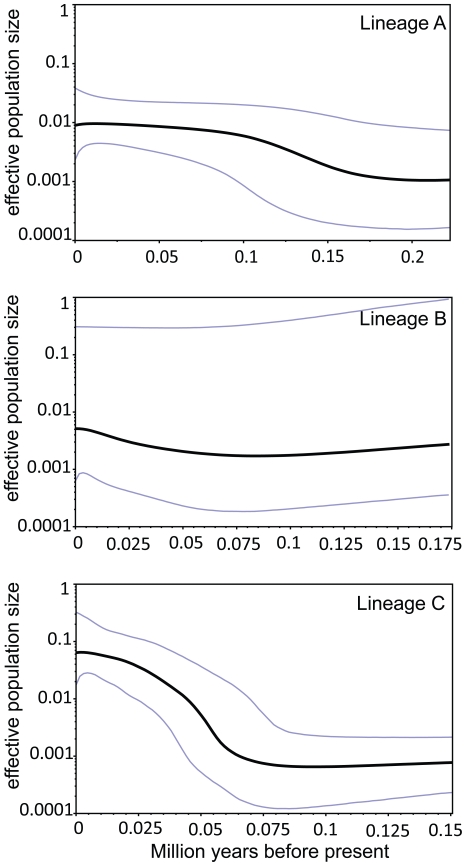
Figure 3. Bayesian skyline plots (BSPs).
The x-axis measures time in millions of years and the y-axis is the scaled effective population size. Dark lines represent media inferred Ne, blue lines mark the 95% highest probability density (HPD) intervals in all panels for lineage A (a), for lineage B (b), and lineage C (c).

