Figure 5.
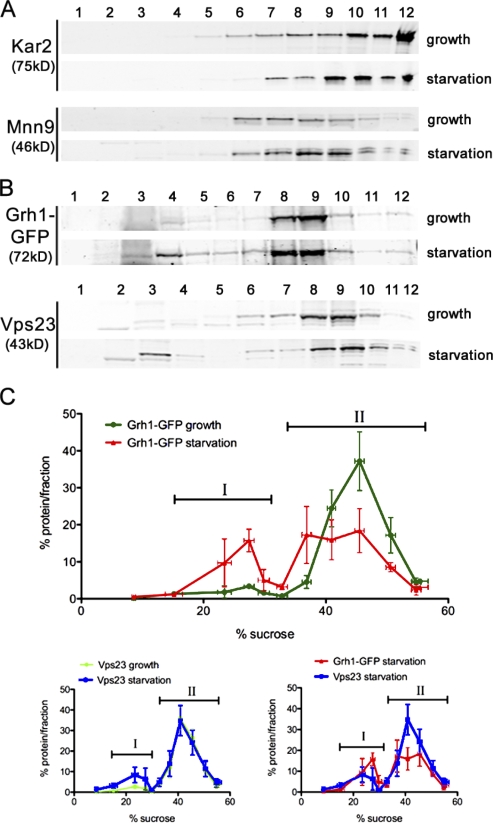
CUPS is separated from the ER and Golgi membranes. (A and B) Yeast cells cultured in growth conditions or starved for 3 h were fractionated on a continuous 15–60% sucrose gradient for 18 h. The gradient fractions were Western blotted to detect the ER protein Kar2 and the Golgi protein Mnn9 (A) or Vps23 and GFP to monitor Grh1-GFP (B). The numbers indicate the fractions. (C) The percentage of protein contained in each fraction was plotted against the sucrose concentration, and the error bars represent the results and SEM from three independent experiments. The fractions marked ‘I’ represent the starvation-specific pool of Grh1 and Vps23, and the denser fractions ‘II’ represent the ER–Golgi pool of Grh1-GFP and the endosomal pool of Vps23.

