
Figure 1.
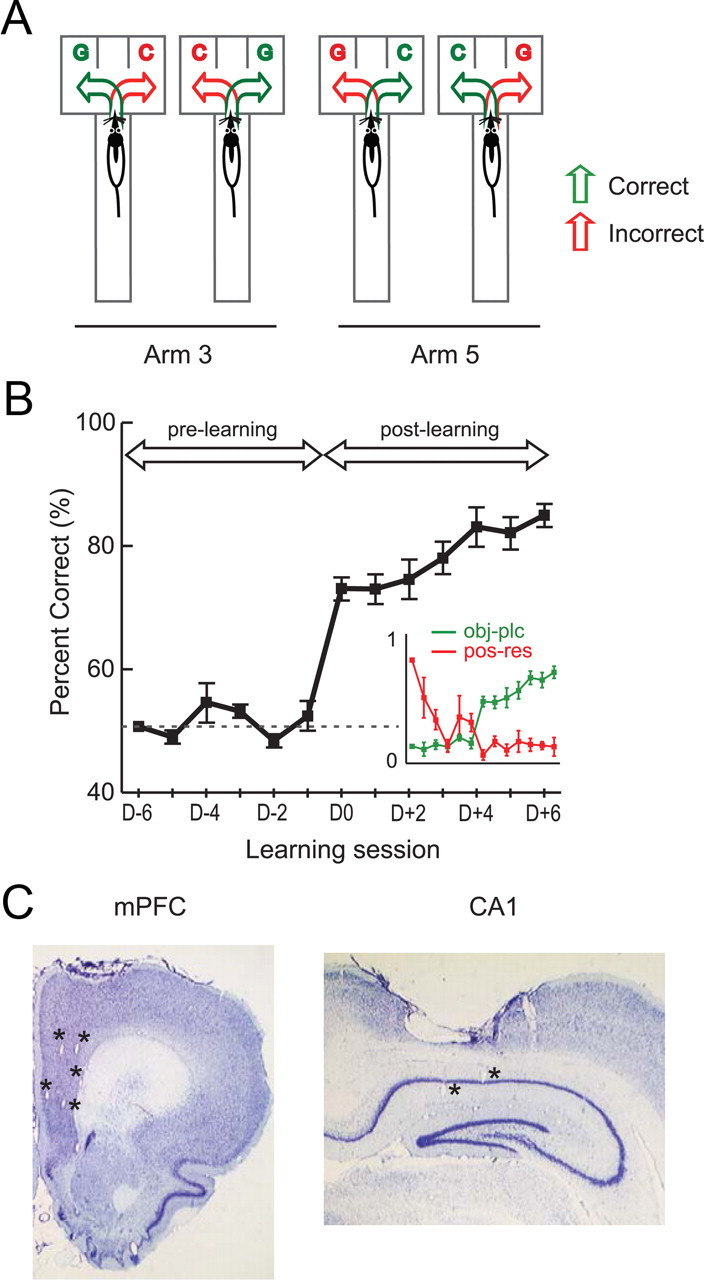
A. Schematic illustration of the OPPA task. In each trial, a rat was required to choose between two objects (toy girl and dummy cylindrical object denoted by G and C, respectively) arranged in a choice platform at the end of either Arm 3 or Arm 5 in a radial maze. Four possible conditions (2 object configurations by 2 arms) are illustrated here. In each condition, two possible choices (green arrow, correct choice; red arrow, incorrect choice) are shown. B, Learning curve in the OPPA task. Overall performance of animals averaged across arms (mean ± SEM) through the acquisition period of the task. The day on which rats performed better than 75% in both arms for the first time was marked as D0 and was used as the boundary for dividing prelearning and postlearning periods. The dotted line represents the chance-level performance (50%). Inset, A crossover of object-in-place strategy index (green) and position-response bias (red) near the acquisition day. The abscissa and ordinate represent learning session and strategy index (scaled from 0 to 1), respectively. C, Histological verifications of recording sites. Representative examples of recording electrode positions in mPFC and CA1 within the same animal are presented. Asterisks indicate tetrode tip positions in mPFC and CA1.