Fig. 3.
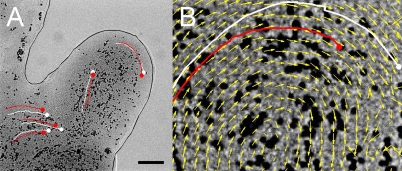
Tracking and modeling conidial transport. (A) Still from a movie showing conidial transport (black spheres) in a background of moving P. vortex. Red trajectories are the tracks of individual conidia, and white trajectories are the tracks of virtual beads (calculation of the motion of bacteria aggregates that can carry beads was as explained in SI Materials and Methods). The continuous black line indicates the edge of the swarming mass. (B) Close-up view with the velocity field (yellow arrows) indicating the direction of local groups of microorganisms to overall describe a typical rotation (or vortex) motion. (Scale bar: A, 20 μm; B, 2 μm.)

